Bloodwork Preview
Premium bloodwork intelligence.
Upload your bloodwork, preview VYTOR extraction, and unlock the full marker grid, optimal ranges, protocols, trends, and premium report outputs.
Bloodwork Intelligence
What VYTOR analyzes.
Inflammation
Cardiometabolic Health
Thyroid Function
Micronutrients
Recovery Status
Hormone Context
Stress Response
Optimization Opportunities
Try The Upload
Upload your bloodwork and preview the extraction.
VYTOR will extract your markers and show a limited preview. Unlock Bloodwork Intelligence to view all markers, compare VYTOR optimal ranges, generate protocols, and export your premium report.
Import Bloodwork
Upload a PDF, screenshot, or photo of your bloodwork. VYTOR will detect the provider, extract biomarkers, and prepare everything for review.
Auto-detect is best for most users. Select a provider manually if you want tighter report-specific matching.
Drag and drop your report
Upload a PDF, lab screenshot, or photo of your report for fast biomarker extraction and review.
Accepted
PDF, JPG, PNG
Detects
Provider + OCR
Review
Confirm before report
Trusted Tester Access
Invited testers can unlock the current bloodwork preview using their access code.
No labs yet?
See how VYTOR displays marker intelligence.
Upload your own report when ready. Until then, this example shows how markers, status dots, VYTOR optimal ranges, and lab references are displayed.
HDL Cholesterol
hdl_cholesterol
VYTOR Optimal
Preview range
Lab Reference
Preview reference
Insulin
fasting_insulin
VYTOR Optimal
Preview range
Lab Reference
Preview reference
hs-CRP
hs_crp
VYTOR Optimal
Preview range
Lab Reference
Preview reference
Trend Intelligence Locked
Track real biomarker movement over time.
Upload multiple reports to unlock Biggest Wins, Needs Attention, Stable Markers, and longitudinal optimization summaries.
Progress over time.
VYTOR compares previous and current panels to highlight improvements, regressions, and stable markers. This turns each new bloodwork upload into a measurable optimization checkpoint.
Biggest Wins
hs-CRP
Inflammation trend improved significantly between panels.
HDL Cholesterol
Positive cardiometabolic movement detected.
Needs Attention
Fasting Insulin
Insulin trend needs attention and follow-up.
ApoB
Atherogenic lipid trend moved upward.
Stable Markers
Vitamin D
Vitamin D remained relatively stable.
Ferritin
Iron storage marker remained stable.
Improved
2
Worsened
2
Stable
2
High Priority
1
4 of 6 tracked markers changed between panels.
Focus attention on high-priority worsening markers while maintaining positive optimization momentum.
Trend Charts
Biomarker movement preview.
Visual comparison of selected markers from previous panel to current panel.
Cholesterol Total
HDL Cholesterol
Triglycerides
LDL Cholesterol
Chol HDL Ratio
Non HDL Cholesterol
Trend Intelligence Locked
Upload multiple reports to track real change.
Unlock longitudinal charts, Biggest Wins, Needs Attention, Stable Markers, and full trend summaries.
Premium Report Preview
Executive PDF outputs.
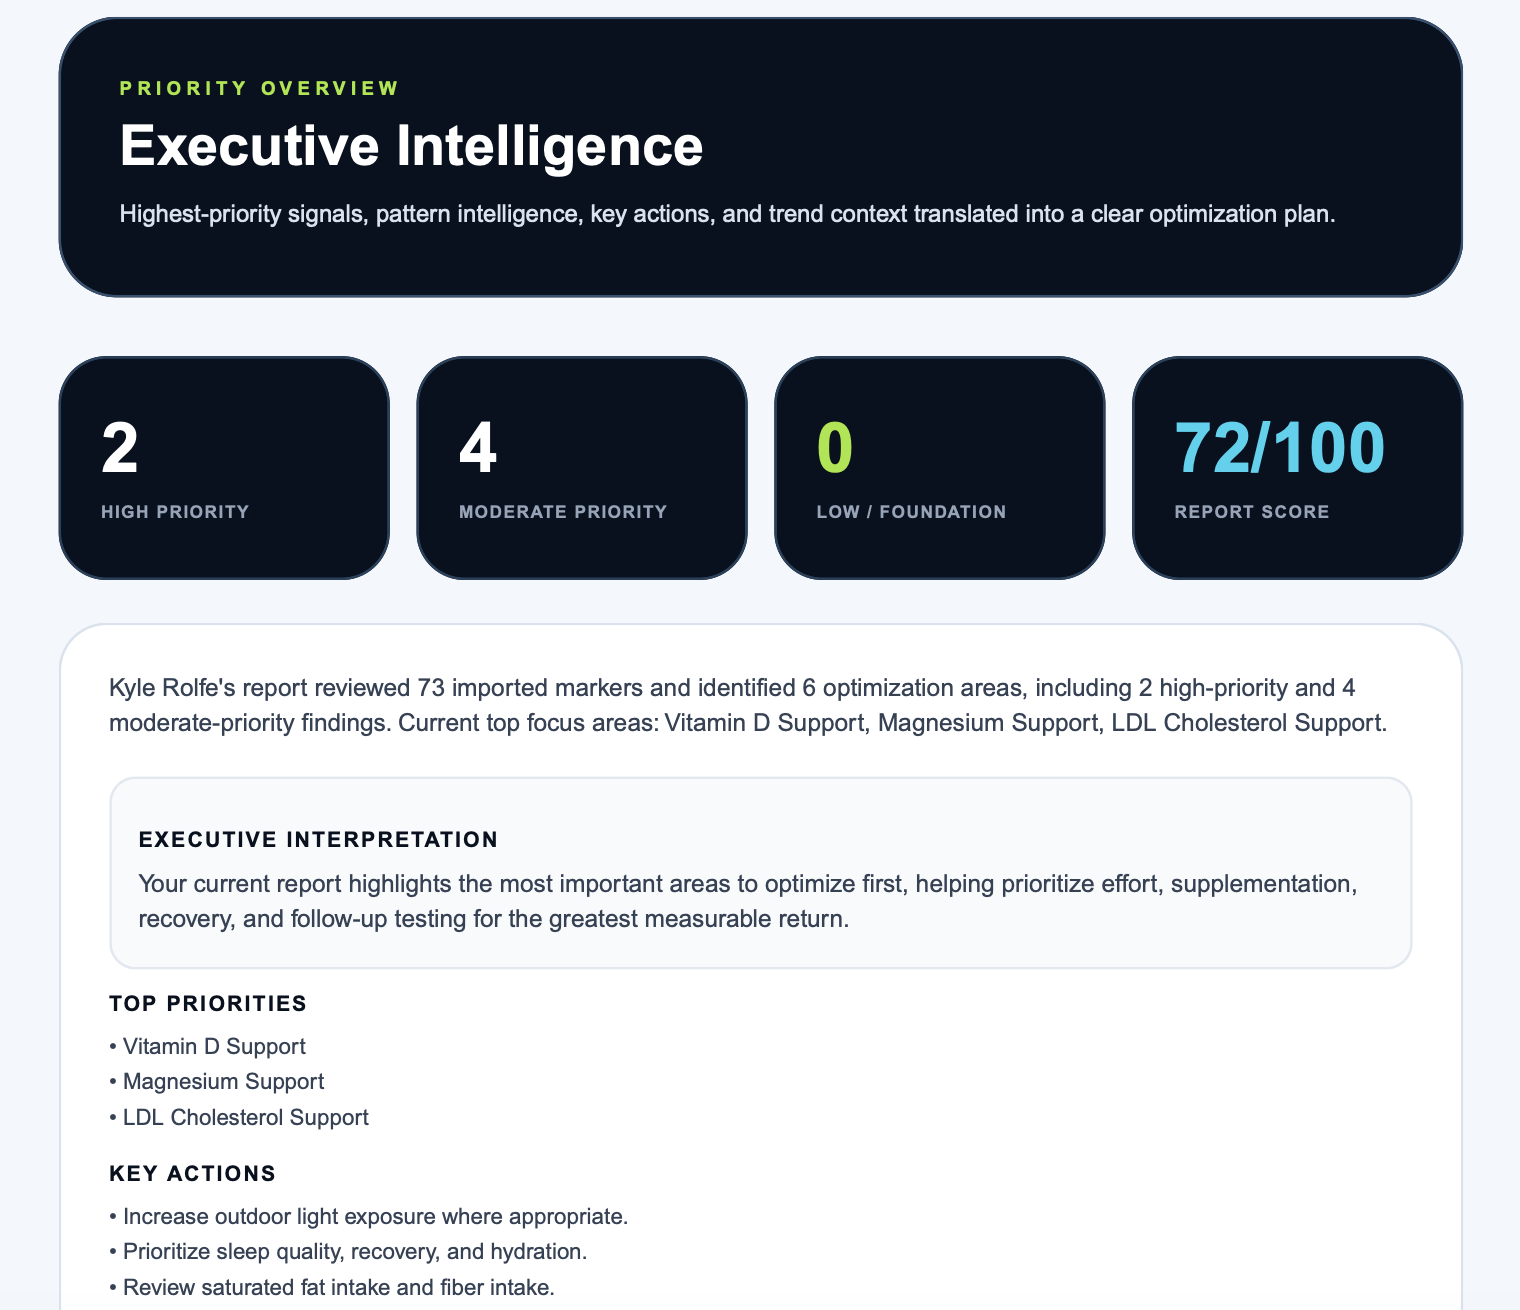
Premium Intelligence
Unlock full VYTOR reporting.
Structured protocols, trend intelligence, biomarker analysis, optimization guidance, and premium PDF exports.
Explore Access